On paper the macguffin service is finished. Part 5 left it typed, fast, documented and served over TLS. So you deploy it, traffic starts flowing, and a week later someone wanders over to say “it’s slow”.
Slow how? Slow where? Which endpoint, the gateway or the gRPC behind it, the store or the network in between? You open the logs and there’s a wall of “request completed” lines, no way to tell which ones belong to the same request, and not a word about the half-second one of them spent somewhere inside. The service is a black box that happens to be on fire.
That’s the gap this part closes. A long-running service needs to be observable: you need to see what it’s doing, how often, how fast, and where the time actually goes. And we get there without bolting on a separate stack, because go-tool-base speaks OpenTelemetry, and three signals fall out of the same wiring.
This part is written against go-tool-base v0.7.1, the release that brings the observability components in.
The three things you actually want to see
“Observability” is a grand word for three fairly down-to-earth questions. Logs answer what happened (you’ve had those since part 1). Metrics answer how often, and how fast: request rates, error counts, the spread of latencies. And traces answer where did the time go, by following a single request as it crosses from one piece of your system to the next.
For a service shaped like ours, that last one is the prize. A REST call hits the gateway, turns into a gRPC call, runs through the store, and comes back. A trace stitches that whole journey into one timeline, so “it’s slow” stops being a shrug and becomes “it’s slow in CreateMacguffin, in the store, for 400ms”. You can’t get there from a pile of disconnected log lines.
OpenTelemetry (OTel, if you’ve seen it bandied about) is the vendor-neutral standard for all three. You instrument once and ship the data to whatever backend you fancy (Jaeger, Grafana, Honeycomb, a plain collector) over one wire protocol, OTLP. go-tool-base does the instrumenting; you point it at a collector and pick your poison.
Turn it on
One call wires the lot. In the serve command from part
4,
right after the controller exists:
// pkg/cmd/serve/main.go

import "gitlab.com/phpboyscout/go-tool-base/pkg/telemetry"

controller := controls.NewController(ctx, controls.WithLogger(p.Logger))

// Build whichever signals are enabled, install them, flush them on shutdown.
if _, err := telemetry.Setup(ctx, p, controller); err != nil {
	return err
}
telemetry.Setup
reads your config, builds whichever of the three signals you’ve switched on, and
installs them as the process-wide OTel providers. It also hangs their shutdown on
the controller, so when a SIGTERM lands the buffered spans and metrics flush
before the process exits. That’s the same graceful-shutdown promise from part 1,
now extended to your telemetry: a clean stop drops nothing, not even the trace
that was mid-flight.
On its own that line shows you nothing. A signal you haven’t enabled is skipped, so an unconfigured service pays exactly nothing. You turn each on in config, which we’ll get to. First, the instrumentation.
Wire it onto the transports
Setup builds the pipeline; two short additions feed it. The gRPC server takes a
stats handler:
// pkg/cmd/serve/main.go

grpcSrv, err := gtbgrpc.Register(ctx, "grpc", controller, p.Config, p.Logger,
	gtbgrpc.OTelStatsHandler())
and the HTTP server takes a middleware. This is also where we finally meet go-tool-base’s middleware chain, which we’ve managed without until now. A chain is just an ordered stack of wrappers around your handler. We put the OTel one first so it opens the span, and the request logger second, so it runs inside that span and can see it:
// pkg/cmd/serve/main.go

chain := gtbhttp.NewChain(
	gtbhttp.OTelMiddleware("macguffin"),
	gtbhttp.LoggingMiddleware(p.Logger),
)

if _, err := gtbhttp.Register(ctx, "http", controller, p.Config, p.Logger, mux,
	gtbhttp.WithMiddleware(chain)); err != nil {
	return err
}
That’s the whole code change. Both helpers,
OTelMiddleware
and
OTelStatsHandler,
lean on the standard OTel instrumentation libraries underneath (otelhttp and
otelgrpc), so the spans and metrics they emit follow the conventions every
backend already knows how to read. Every request now opens a span and records its
own duration, on both transports, and you wrote none of it per handler.
Go deeper than the plumbing
The transport spans show the request crossing HTTP and gRPC, but they stop at the edge of your handler. To see where the time goes inside it, you open a span yourself, and that needs no go-tool-base API at all, just OpenTelemetry. Here’s the store doing it, opening a span around the work and tagging it with what it’s handling:
// internal/macguffin/store.go

import (
	"go.opentelemetry.io/otel"
	"go.opentelemetry.io/otel/attribute"
)

var tracer = otel.Tracer("macguffinsvc/store")

func (s *Store) Create(ctx context.Context, name string, quantity int32) Macguffin {
	_, span := tracer.Start(ctx, "Store.Create")
	defer span.End()

	span.SetAttributes(
		attribute.String("macguffin.name", name),
		attribute.Int("macguffin.quantity", int(quantity)),
	)

	// ... store the macguffin, generate its id ...

	span.SetAttributes(attribute.String("macguffin.id", id))

	return m
}
The span starts as a child of whatever is already in the context, which is the
gRPC server span the handler is running under, so it slots into the trace on its
own. The one thing to get right is the context: give the store method a
ctx context.Context first parameter and thread it down from the handler, and the
span finds its parent. Tag it with the things you’d want when something’s wrong,
the macguffin’s name and its id, and they show up on the span in the UI, right
next to the timing.
Point it at a collector
The wiring’s on; now tell it where to send. The config lives under one root:
# config.yaml
telemetry:
  endpoint: "http://localhost:4318"
  insecure: true              # plaintext: a local collector only
  tracing:
    enabled: true
    sampling: 1.0             # every trace while you're looking
  metrics:
    enabled: true
  logs:
    enabled: true
endpoint is your OTLP collector. Sampling defaults to a level-headed 0.1 in
production (you rarely want every trace under real load), so turn it up to 1.0
while you’re developing or you’ll wonder where yours went. Stand up a collector (a
local Jaeger handles traces and gives you a UI to poke at), start the service, and
push some traffic through the REST side:
$ curl https://localhost:8443/v1/macguffins
$ curl -X POST https://localhost:8443/v1/macguffins -d '{"name":"the-grail","quantity":1}'
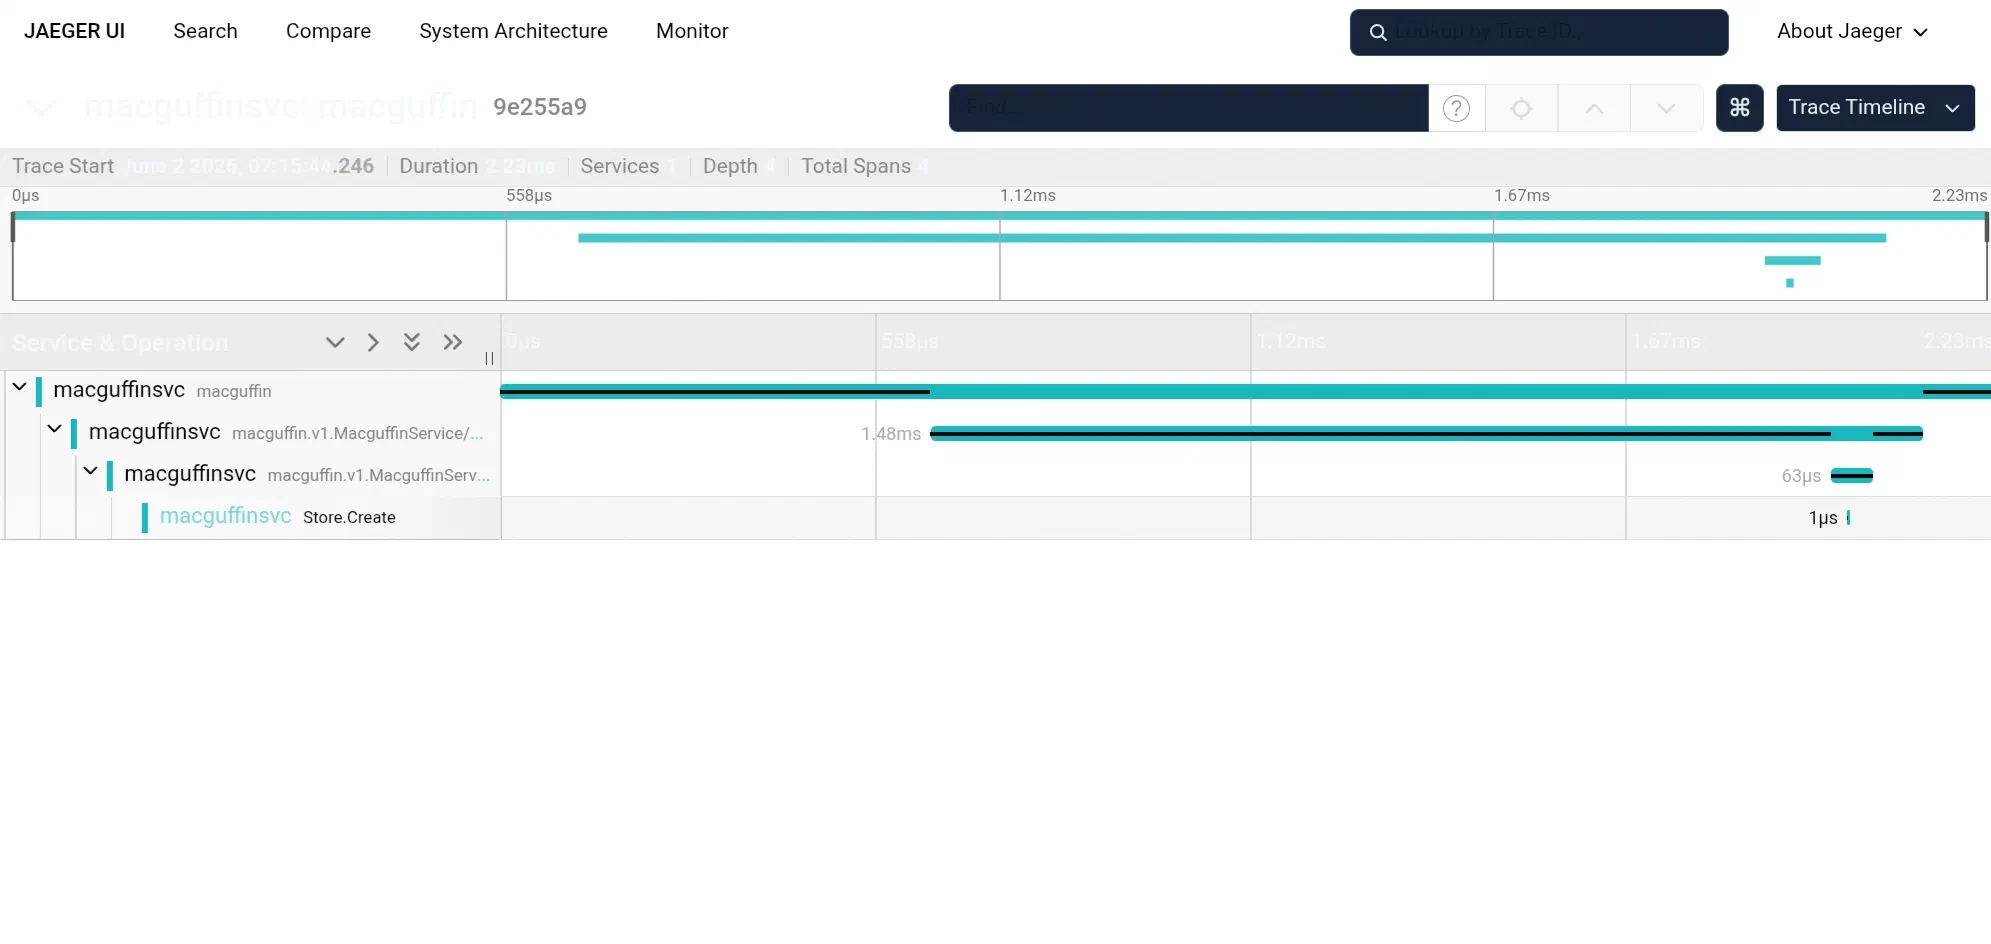
One request, the whole way through
Open the collector and there it is, the thing that justifies the exercise: a
single trace for that POST, four spans deep. The HTTP server span on top, the
gRPC call nested inside it, the gRPC handler inside that, and your Store.Create
span at the bottom, with the macguffin’s name and id sat right on it. The REST
request became a gRPC call, crossed the gateway we built in part 4, ran the
handler and went into the store, and OTel followed it the entire way, because the
trace context travels with the request and everything reads from the same
providers. “It’s slow” finally has somewhere to point, and “slow where” has an
answer.
The metrics ride the same pipeline: request counts, error counts, a latency
histogram broken down by route and method. And your logs get an upgrade you didn’t
ask for. Every “request completed” line now carries the trace_id and span_id
of the request it describes, so a slow trace in the UI and its log line in your
terminal share an id, and you can jump straight from one to the other. That
correlation lands in your stderr logs and in the records shipped to the collector,
both.
A word on the other telemetry
If you read Telemetry that asks first, you’ll know go-tool-base has a telemetry package for product analytics too: the opt-in kind that asks a user’s permission before it phones anything home. This is not that, and the difference is the whole point.
That analytics is about a user, and it’s gated behind informed consent: off until they say yes. This is about your service, emitted by you, to a collector you run, and it works on implied consent. You switched it on; there’s no end user in the loop to ask. Same package, deliberately separate gates, and never the twain shall meet. There’s a fuller post in that one distinction, and it’s the next thing I’m writing.
Where that leaves the service
Six parts in, the macguffin service starts cleanly, reports its health, serves gRPC and REST and interactive docs over TLS, shuts down without dropping a request, and now tells you what it’s doing while it runs, all from one annotated proto and a controller it registers against. Observability was the last missing sense. The thing was fast and correct before, but you couldn’t see inside it. Now you can, and it cost you about a dozen lines.